
Finviz | Carnival Corporation & Plc operates as a leisure travel company. The company's ships visit approximately 700 ports under the Carnival Cruise Line, Princess Cruises, Holland America Line, Seabourn, P&O Cruises (Australia), Costa Cruises, AIDA Cruises, P&O Cruises (UK), and Cunard brand names. It also provides vacations to various cruise destinations, as well as owns and operates hotels, lodges, glass-domed railcars, and motor coaches. The company sells its cruises primarily through travel agents and tour operators. It operates in the United States, Canada, Continental Europe, the United Kingdom, Australia, New Zealand, Asia, and internationally. As of January 28, 2020, the company operated 105 ships with 254,000 lower berths. Carnival Corporation & Plc was incorporated in 1972 and is headquartered in Miami, Florida. |
Some Quick Observations
Basic | ||
Optionable | Yes | I do credit spreads sometimes |
Shortable | Yes | I play both sides of the market |
Share Price > $5 | 16.21 | No Penny Stocks |
Market Cap | 14.62B | Must be greater than 300M. We want no Penny Stocks |
Valuation | ||
Profitability - Past 5 yrs | - | PE Positive |
Profitability Q/Q | - | PE Positive |
Sales Growth past 5 yrs | 5.60% | 10% growth the last 5 years |
Projected Sales Growth 5 yrs | -99.50% | |
EPS | -10.28 | A negative EPS tells you exactly how much money the company lost per share of outstanding stock, which is why you'll also see it called "net loss per share." If a company with 100 million shares loses $16 million, then its EPS is negative 16 cents. |
Book Value per share | 25.17 |
Financial | ||
Debt to Equity | 1.28 | A good debt to equity ratio is around 1 to 1.5. |
Current Ratio | 0.9 | a current ratio of 1.5 or above is considered healthy, while a ratio of 1 or below suggests the company would struggle to pay its liabilities and might go bankrupt |
Quick Ratio | 0.9 | A result of 1 is considered to be the normal quick ratio. ... A company that has a quick ratio of less than 1 may not be able to fully pay off its current liabilities in the short term, while a company having a quick ratio higher than 1 can instantly get rid of its current liabilities |
Buy it? | ||
Current Price | 16.21 | |
Target Price | 16.38 | Produced by Analysts |
Bargain | 0.17 | A positive number indicates trading under Target Price |
Graham Number | Negative number is a good value | |
Analysts Ranking | 2.9 | 1=Buy 5=Sell |
Earning | Oct 08 BMO | Next Earning Date |
Take some action! | |||
CCL | Carnival Corp | Expected Profit | |
Direction | Open Short | ||
Date Opened | 11/11/2020 | ||
-$36.00 | |||
Price Opened | $16.20 | Expected Loss | |
Target Price | $15.71 | ||
Stop Loss | $16.61 | ||
Number of Shares Purchased | 74 | -$30.00 | |
Backtest Model for Risk Management
Profit | 3.00% | Stop Loss | 2.50% | Risk Amount | $1,200.00 | Base Amount | $5,000.00 |
Backtest Action: Not all trades taken | Win Loss % | 66.67% | $297.54 | |||
Trade | Date | Price | Contracts | # bars | % chg | Profit |
Long (profit) | 1/3/2019 | 47.37 | 12 | 2 | 5.66% | 32.16 |
Long (profit) | 1/7/2019 | 50.64 | 11 | 4 | 3.26% | 18.15 |
Short (profit) | 2/22/2019 | 58.82 | 10 | 7 | -3.84% | 22.6 |
Long (profit) | 4/1/2019 | 52.19 | 11 | 12 | 5.00% | 28.71 |
Short (profit) | 5/3/2019 | 55.18 | 10 | 7 | -4.35% | 24 |
Short (profit) | 9/17/2019 | 49.37 | 12 | 5 | -3.38% | 20.04 |
Long (profit) | 10/10/2019 | 40.95 | 14 | 4 | 3.76% | 21.56 |
Short (profit) | 1/22/2020 | 49.88 | 12 | 3 | -4.73% | 28.32 |
Long (max loss) | 3/11/2020 | 21.75 | 27 | 2 | -31.17% | -183.06 |
Long (max loss) | 3/16/2020 | 14.57 | 41 | 2 | -12.77% | -76.26 |
Long (profit) | 3/20/2020 | 12 | 50 | 3 | 14.00% | 84 |
Long (profit) | 3/25/2020 | 15.55 | 38 | 2 | 14.60% | 86.26 |
Long (profit) | 4/6/2020 | 10.21 | 58 | 2 | 10.68% | 63.22 |
Short (max loss) | 5/1/2020 | 13.93 | 43 | 2 | 2.94% | -17.63 |
Short (max loss) | 5/29/2020 | 15.74 | 38 | 2 | 6.73% | -40.28 |
Short (profit) | 6/10/2020 | 20.59 | 29 | 2 | -15.30% | 91.35 |
Short (profit) | 6/12/2020 | 19.98 | 30 | 4 | -4.45% | 26.7 |
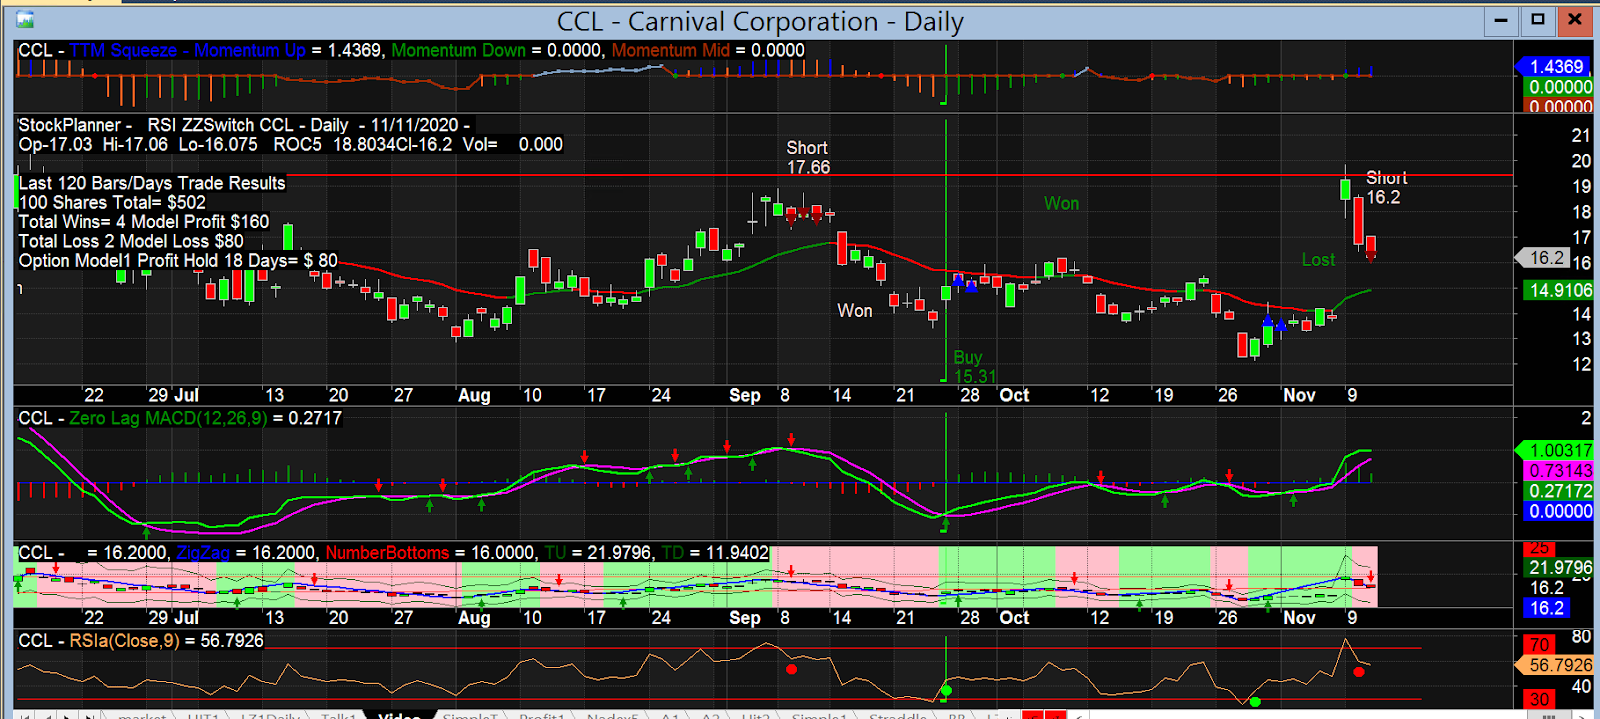
Short (profit) | 9/9/2020 | 17.66 | 33 | 5 | -9.80% | 57.09 |
Long (profit) | 9/28/2020 | 15.31 | 39 | 8 | 4.44% | 26.52 |
Long (max loss) | 10/30/2020 | 13.71 | 43 | 4 | -2.70% | -15.91 |
Open Short | 11/11/2020 | 16.2 | 37 | 2 | 0.00% | 0 |

No comments:
Post a Comment